Disclaimer
All information and publications on www.amend-finance.de are not to be understood as financial, investment, trading or any other type of advice or recommendation, in particular no investment advice is given. The recipient of the information acts exclusively at their own risk and peril!
Trading Bitcoin involves a significant risk of loss, up to and including total loss!
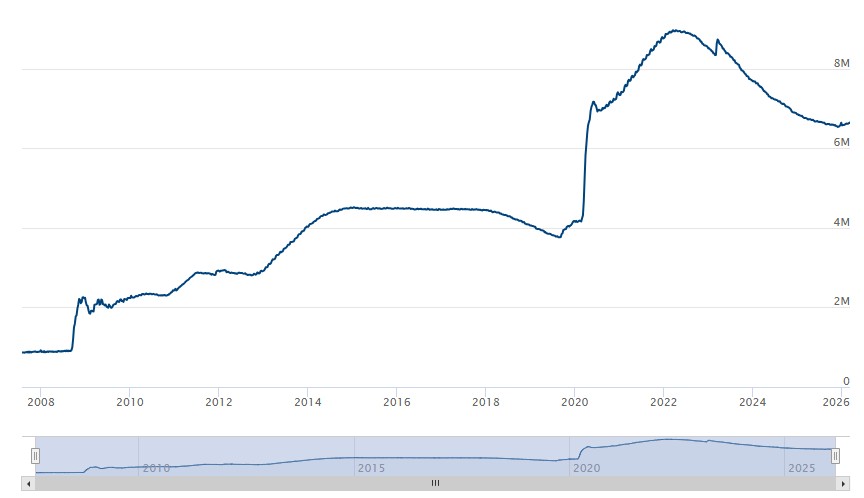
Data as of March 11, 2026
Cashflow: 206,74 Mrd. USD
Inflow: 130,77 Mrd. USD
Outflow: $76.87 billion
Delta: $53.90 billion
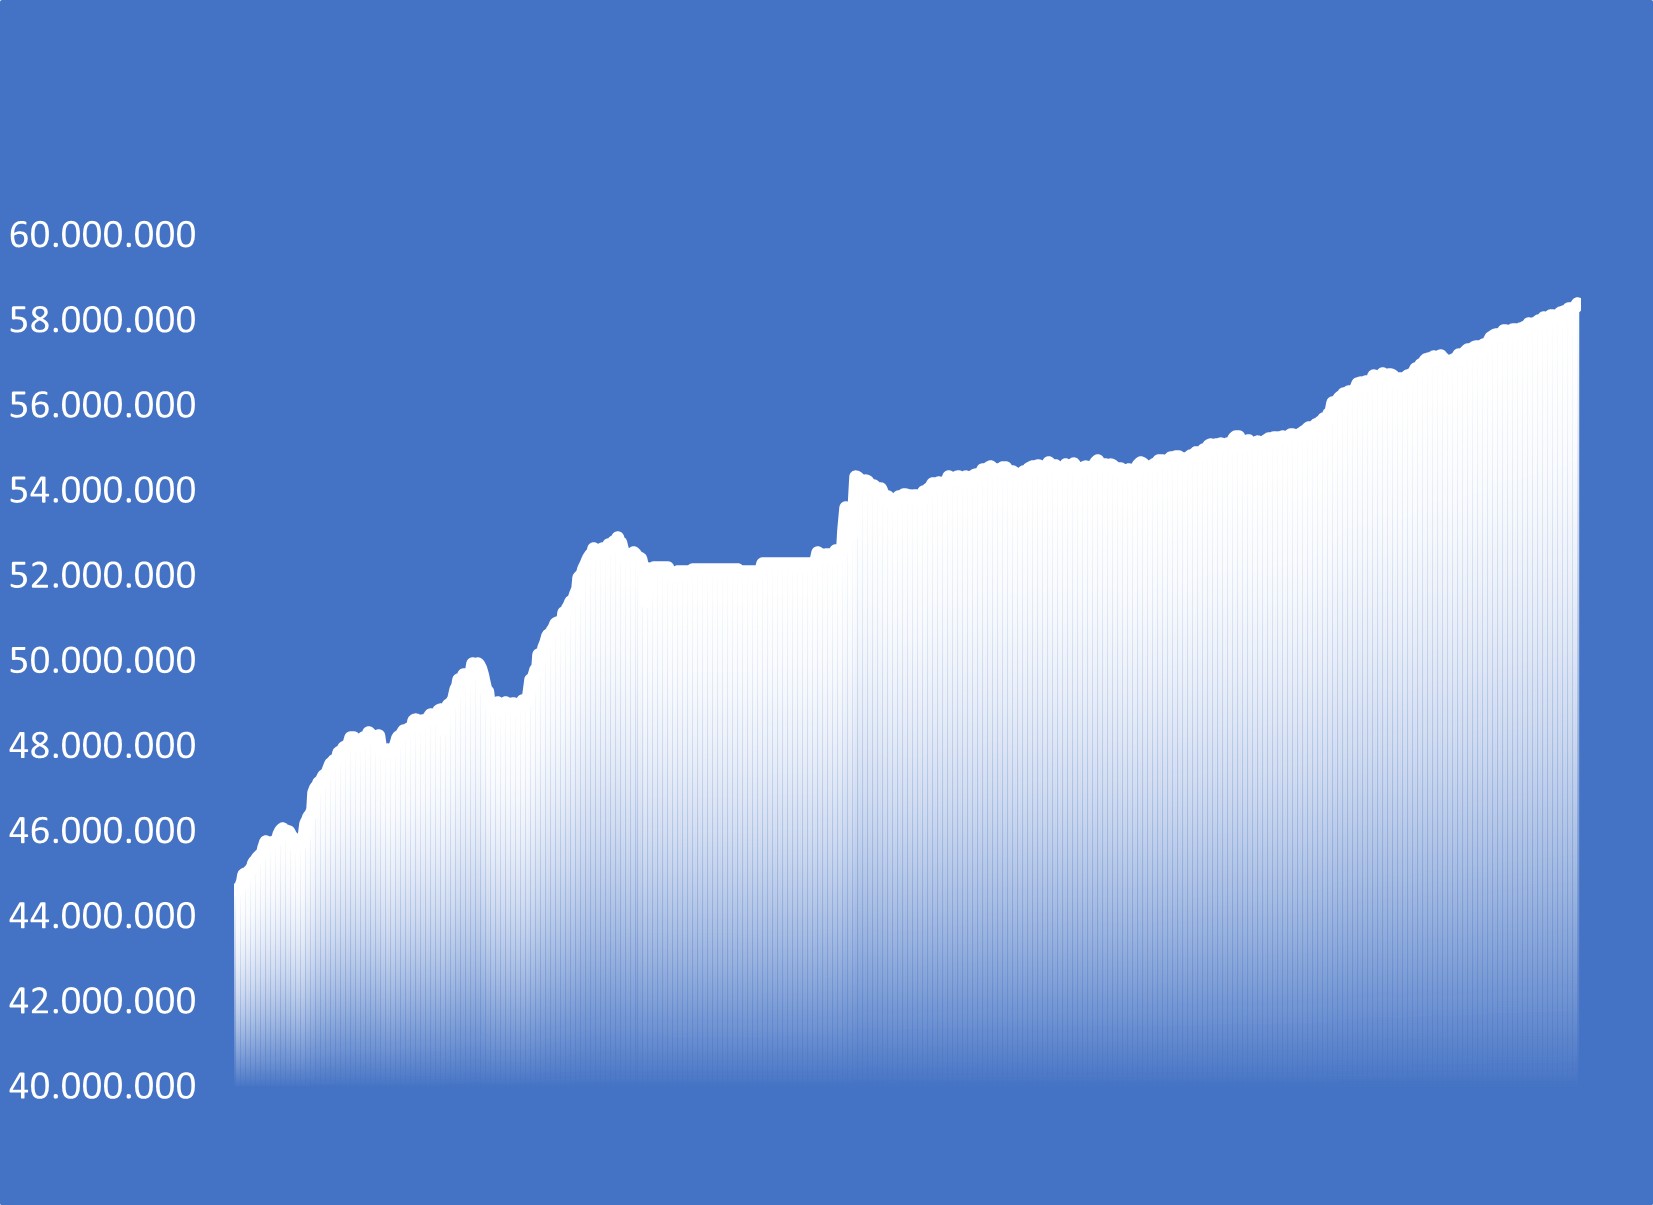
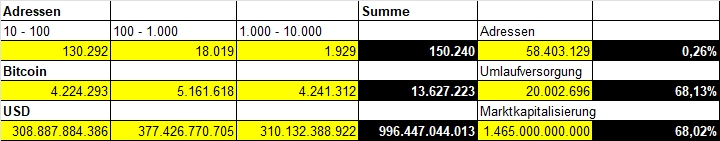
58.339.037

Amend Finance
Vertreten durch:
Prof. Dr. Udo Amend
Verantwortlich für den Inhalt nach § 55 Abs. 2 RStV:
Prof. Dr. Udo Amend
Oberacher 1
CH-6315 Morgarten
E-Mail: ud******@*mx.de
Haftungsausschluss:
Haftung für Inhalte
Die Inhalte unserer Seiten wurden mit größter Sorgfalt erstellt. Für die Richtigkeit, Vollständigkeit und Aktualität der Inhalte können wir jedoch keine Gewähr übernehmen. Als Diensteanbieter sind wir gemäß § 7 Abs.1 DDG für eigene Inhalte auf diesen Seiten nach den allgemeinen Gesetzen verantwortlich. Nach §§ 8 bis 10 DDG sind wir als Diensteanbieter jedoch nicht verpflichtet, übermittelte oder gespeicherte fremde Informationen zu überwachen oder nach Umständen zu forschen, die auf eine rechtswidrige Tätigkeit hinweisen. Verpflichtungen zur Entfernung oder Sperrung der Nutzung von Informationen nach den allgemeinen Gesetzen bleiben hiervon unberührt. Eine diesbezügliche Haftung ist jedoch erst ab dem Zeitpunkt der Kenntnis einer konkreten Rechtsverletzung möglich. Bei Bekanntwerden von entsprechenden Rechtsverletzungen werden wir diese Inhalte umgehend entfernen.
Haftung für Links
Unser Angebot enthält Links zu externen Webseiten Dritter, auf deren Inhalte wir keinen Einfluss haben. Deshalb können wir für diese fremden Inhalte auch keine Gewähr übernehmen. Für die Inhalte der verlinkten Seiten ist stets der jeweilige Anbieter oder Betreiber der Seiten verantwortlich. Die verlinkten Seiten wurden zum Zeitpunkt der Verlinkung auf mögliche Rechtsverstöße überprüft. Rechtswidrige Inhalte waren zum Zeitpunkt der Verlinkung nicht erkennbar. Eine permanente inhaltliche Kontrolle der verlinkten Seiten ist jedoch ohne konkrete Anhaltspunkte einer Rechtsverletzung nicht zumutbar. Bei Bekanntwerden von Rechtsverletzungen werden wir derartige Links umgehend entfernen.
Urheberrecht
Die durch die Seitenbetreiber erstellten Inhalte und Werke auf diesen Seiten unterliegen dem deutschen Urheberrecht. Die Vervielfältigung, Bearbeitung, Verbreitung und jede Art der Verwertung außerhalb der Grenzen des Urheberrechtes bedürfen der schriftlichen Zustimmung des jeweiligen Autors bzw. Erstellers. Downloads und Kopien dieser Seite sind nur für den privaten, nicht kommerziellen Gebrauch gestattet. Soweit die Inhalte auf dieser Seite nicht vom Betreiber erstellt wurden, werden die Urheberrechte Dritter beachtet. Insbesondere werden Inhalte Dritter als solche gekennzeichnet. Sollten Sie trotzdem auf eine Urheberrechtsverletzung aufmerksam werden, bitten wir um einen entsprechenden Hinweis. Bei Bekanntwerden von Rechtsverletzungen werden wir derartige Inhalte umgehend entfernen.
Datenschutz
Die Nutzung unserer Webseite ist in der Regel ohne Angabe personenbezogener Daten möglich. Soweit auf unseren Seiten personenbezogene Daten (beispielsweise Name, Anschrift oder eMail-Adressen) erhoben werden, erfolgt dies, soweit möglich, stets auf freiwilliger Basis. Diese Daten werden ohne Ihre ausdrückliche Zustimmung nicht an Dritte weitergegeben.
Wir weisen darauf hin, dass die Datenübertragung im Internet (z.B. bei der Kommunikation per E-Mail) Sicherheitslücken aufweisen kann. Ein lückenloser Schutz der Daten vor dem Zugriff durch Dritte ist nicht möglich.
Der Nutzung von im Rahmen der Impressumspflicht veröffentlichten Kontaktdaten durch Dritte zur Übersendung von nicht ausdrücklich angeforderter Werbung und Informationsmaterialien wird hiermit ausdrücklich widersprochen. Die Betreiber der Seiten behalten sich ausdrücklich rechtliche Schritte im Falle der unverlangten Zusendung von Werbeinformationen, etwa durch Spam-Mails, vor.
Google Analytics
Diese Website benutzt Google Analytics, einen Webanalysedienst der Google Inc. (”Google”). Google Analytics verwendet sog. ”Cookies”, Textdateien, die auf Ihrem Computer gespeichert werden und die eine Analyse der Benutzung der Website durch Sie ermöglicht. Die durch den Cookie erzeugten Informationen über Ihre Benutzung dieser Website (einschließlich Ihrer IP-Adresse) wird an einen Server von Google in den USA übertragen und dort gespeichert. Google wird diese Informationen benutzen, um Ihre Nutzung der Website auszuwerten, um Reports über die Websiteaktivitäten für die Websitebetreiber zusammenzustellen und um weitere mit der Websitenutzung und der Internetnutzung verbundene Dienstleistungen zu erbringen. Auch wird Google diese Informationen gegebenenfalls an Dritte übertragen, sofern dies gesetzlich vorgeschrieben oder soweit Dritte diese Daten im Auftrag von Google verarbeiten. Google wird in keinem Fall Ihre IP-Adresse mit anderen Daten der Google in Verbindung bringen. Sie können die Installation der Cookies durch eine entsprechende Einstellung Ihrer Browser Software verhindern; wir weisen Sie jedoch darauf hin, dass Sie in diesem Fall gegebenenfalls nicht sämtliche Funktionen dieser Website voll umfänglich nutzen können. Durch die Nutzung dieser Website erklären Sie sich mit der Bearbeitung der über Sie erhobenen Daten durch Google in der zuvor beschriebenen Art und Weise und zu dem zuvor benannten Zweck einverstanden.
Google AdSense
Diese Website benutzt Google Adsense, einen Webanzeigendienst der Google Inc., USA (”Google”). Google Adsense verwendet sog. ”Cookies” (Textdateien), die auf Ihrem Computer gespeichert werden und die eine Analyse der Benutzung der Website durch Sie ermöglicht. Google Adsense verwendet auch sog. ”Web Beacons” (kleine unsichtbare Grafiken) zur Sammlung von Informationen. Durch die Verwendung des Web Beacons können einfache Aktionen wie der Besucherverkehr auf der Webseite aufgezeichnet und gesammelt werden. Die durch den Cookie und/oder Web Beacon erzeugten Informationen über Ihre Benutzung dieser Website (einschließlich Ihrer IP-Adresse) werden an einen Server von Google in den USA übertragen und dort gespeichert. Google wird diese Informationen benutzen, um Ihre Nutzung der Website im Hinblick auf die Anzeigen auszuwerten, um Reports über die Websiteaktivitäten und Anzeigen für die Websitebetreiber zusammenzustellen und um weitere mit der Websitenutzung und der Internetnutzung verbundene Dienstleistungen zu erbringen. Auch wird Google diese Informationen gegebenenfalls an Dritte übertragen, sofern dies gesetzlich vorgeschrieben oder soweit Dritte diese Daten im Auftrag von Google verarbeiten. Google wird in keinem Fall Ihre IP-Adresse mit anderen Daten der Google in Verbindung bringen. Das Speichern von Cookies auf Ihrer Festplatte und die Anzeige von Web Beacons können Sie verhindern, indem Sie in Ihren Browser-Einstellungen ”keine Cookies akzeptieren” wählen (Im MS Internet-Explorer unter ”Extras > Internetoptionen > Datenschutz > Einstellung”; im Firefox unter ”Extras > Einstellungen > Datenschutz > Cookies”); wir weisen Sie jedoch darauf hin, dass Sie in diesem Fall gegebenenfalls nicht sämtliche Funktionen dieser Website voll umfänglich nutzen können. Durch die Nutzung dieser Website erklären Sie sich mit der Bearbeitung der über Sie erhobenen Daten durch Google in der zuvor beschriebenen Art und Weise und zu dem zuvor benannten Zweck einverstanden.
Amend Finance
Represented by:
Prof. Dr. Udo Amend
Responsible for content according to § 55 para. 2 RStV:
Prof. Dr. Udo Amend
Oberacher 1
CH-6315 Morgarten
Email: ud******@*mx.de
Disclaimer:
Liability for content
The content of our pages was created with the greatest care. However, we cannot accept any liability for the accuracy, completeness and timeliness of the content. As a service provider, we are responsible for our own content on these pages in accordance with § 7 para. 1 DDG. However, according to §§ 8 to 10 DDG, as a service provider, we are not obliged to monitor submitted or stored third-party information or to search for circumstances that indicate illegal activity. Obligations to remove or block the use of information in accordance with general laws remain unaffected. In this case, liability is only possible at the time of knowledge about a specific violation of law. If we become aware of any such violations of law, we will remove this content immediately.
Liability for links
Our offer contains links to external third-party websites over whose content we have no influence. We therefore cannot accept any liability for this external content. The respective provider or operator of the site is always responsible for the content of the linked pages. The linked pages were checked for possible violations of law at the time of linking. Illegal content was not recognizable at the time of linking. However, permanent control of the content of the linked pages is not reasonable without concrete evidence of a violation of law. If we become aware of any violations of law, we will remove such links immediately.
Copyright
The content and works on these pages created by the site operators are subject to German copyright law. Duplication, processing, distribution and any type of exploitation outside the limits of copyright law require the written consent of the respective author or creator. Downloads and copies of this page are only permitted for private, non-commercial use. Insofar as the content on this page was not created by the operator, the copyrights of third parties are observed. In particular, third-party content is marked as such. Should you nevertheless become aware of a copyright infringement, we ask you to inform us accordingly. If we become aware of any infringements, we will remove such content immediately.
Data protection
Using our website is generally possible without providing personal data. If personal data (such as name, address or email addresses) is collected on our pages, this is always done on a voluntary basis wherever possible. This data will not be passed on to third parties without your express consent. We would like to point out that data transmission on the Internet (e.g. when communicating by email) can have security gaps. Complete protection of data against access by third parties is not possible. The use of contact data published as part of the imprint obligation by third parties to send unsolicited advertising and information materials is hereby expressly prohibited. The operators of the pages expressly reserve the right to take legal action in the event of unsolicited advertising information being sent, for example through spam emails.
Google Analytics
This website uses Google Analytics, a web analysis service provided by Google Inc. (“Google”). Google Analytics uses so-called “cookies”, text files that are stored on your computer and that enable an analysis of your use of the website. The information generated by the cookie about your use of this website (including your IP address) is transmitted to a Google server in the USA and stored there. Google will use this information to evaluate your use of the website, to compile reports on website activity for website operators and to provide other services related to website activity and internet usage. Google may also transfer this information to third parties where required to do so by law, or where third parties process this data on Google’s behalf. Google will never associate your IP address with other Google data. You can prevent the installation of cookies by setting your browser software accordingly; however, we would like to point out that in this case you may not be able to use all functions of this website to their full extent. By using this website, you consent to the processing of data about you by Google in the manner and for the purposes set out above.
Google AdSense
This website uses Google Adsense, a web advertising service provided by Google Inc., USA (“Google”). Google Adsense uses so-called “cookies” (text files) that are stored on your computer and that enable an analysis of your use of the website. Google Adsense also uses so-called “web beacons” (small invisible graphics) to collect information. By using the web beacon, simple actions such as visitor traffic on the website can be recorded and collected. The information generated by the cookie and/or web beacon about your use of this website (including your IP address) is transmitted to a Google server in the USA and stored there. Google will use this information to evaluate your use of the website in relation to the advertisements, to compile reports on website activity and advertisements for website operators and to provide other services relating to website activity and internet usage. Google may also transfer this information to third parties where required to do so by law, or where third parties process the data on Google’s behalf. Google will never associate your IP address with other Google data. You can prevent cookies from being saved on your hard disk and web beacons from being displayed by selecting “Do not accept cookies” in your browser settings (in MS Internet Explorer under “Tools > Internet Options > Privacy > Settings”; in Firefox under “Tools > Settings > Privacy > Cookies”); however, please note that if you do this you may not be able to use the full functionality of this website. By using this website you consent to the processing of data about you by Google in the manner and for the purposes set out above.