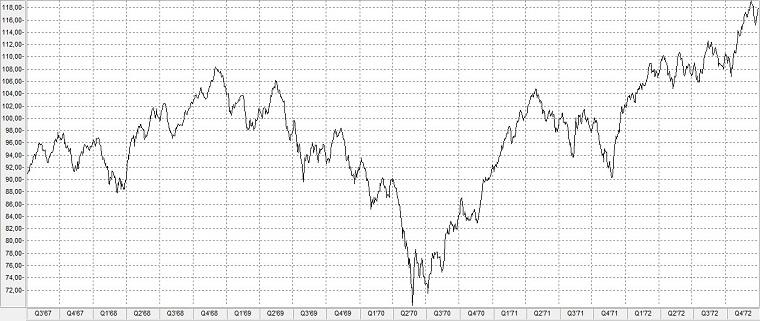

In the so-called, almost forgotten, tech crash of 1970, the S&P 500 Index fell a total of 36.1% from its high of 108.37 points reached on 29 November 1968 to a low of 69.29 points by 26 May.
S&P 500 Höchststand bei 108,37 Punkten.
S&P 500 Tiefststand bei 69,29 Punkten.
Vollständige Erholung des S&P 500.
A period of excessive euphoria, preceding most crashes and in this case spurred by the first moon flights of the Apollo missions, sent share prices soaring to extreme heights.
However, despite the boom in the technology and computer industries, there was an extreme crash in share prices. The main cause of the crash, just like the bursting of the dotcom bubble in 2000, was low or no corporate profits. The average price-earnings ratio of technology stocks in 1968 was 114. Computer manufacturers were trading at 103 times their earnings. By comparison, stocks in the Dow Jones Index had an average P/E ratio of 16 in the peak year of 1968.
IBM, for example, could not meet the growing demand for its new System 370. The distribution system of bundling hardware and software was questioned by the Department of Justice and resulted in a 13-year-old lawsuit, the substance of which was eventually overtaken by developments in the industry and eventually shelved.

Devaluation is the reduction of the nominal exchange rate of one’s own currency against foreign currencies when quoted in quantity. The opposite is revaluation.
The Dow Jones Industrial Average (DJIA) – also known as the Dow Jones Index in Europe – is one of several stock indices created by the founders of the Wall Street Journal and the Dow Jones company, Charles Dow (1851-1902) and Edward Jones (1856-1920), in 1884.
Charles Dow compiled the index to measure the performance of the US stock market. The Dow Jones Index on the New York Stock Exchange (NYSE) is the oldest stock index still in existence in the USA after the Dow Jones Transportation Average and today is made up of 30 of the largest US companies.
The Federal Reserve System, often called the Federal Reserve or simply the Fed (as the US Federal Reserve), is the central banking system of the United States.
In the stock market, the word bull market (or bull market [os]; French for rise, increase) stands for persistently rising stock market prices, whereas bear market (or bear market [bɛs]; French for decline, decrease) stands for persistently falling prices. A “stock market cycle” comprises a bull market and a bear market.
Hedge funds are actively managed investment funds in the financial sector whose business purpose is to make alternative investments and which therefore take on higher financial risks than classic investment funds.
The S&P 500 (Standard & Poor’s 500) is a stock index comprising the shares of 500 of the largest listed US companies. The S&P 500 is weighted by market capitalisation and is one of the most widely followed stock indices in the world.
The New Deal was a series of programs, pubIic work projects, financial reforms, and regulations enacted by President Franklin D. Roosevelt in the United States between 1933 and 1939.
Amend Finance
Represented by:
Prof. Dr. Udo Amend
Responsible for content according to § 55 para. 2 RStV:
Prof. Dr. Udo Amend
Oberacher 1
CH-6315 Morgarten
Email: ud******@*mx.de
Disclaimer:
Liability for content
The content of our pages was created with the greatest care. However, we cannot accept any liability for the accuracy, completeness and timeliness of the content. As a service provider, we are responsible for our own content on these pages in accordance with § 7 para. 1 DDG. However, according to §§ 8 to 10 DDG, as a service provider, we are not obliged to monitor submitted or stored third-party information or to search for circumstances that indicate illegal activity. Obligations to remove or block the use of information in accordance with general laws remain unaffected. In this case, liability is only possible at the time of knowledge about a specific violation of law. If we become aware of any such violations of law, we will remove this content immediately.
Liability for links
Our offer contains links to external third-party websites over whose content we have no influence. We therefore cannot accept any liability for this external content. The respective provider or operator of the site is always responsible for the content of the linked pages. The linked pages were checked for possible violations of law at the time of linking. Illegal content was not recognizable at the time of linking. However, permanent control of the content of the linked pages is not reasonable without concrete evidence of a violation of law. If we become aware of any violations of law, we will remove such links immediately.
Copyright
The content and works on these pages created by the site operators are subject to German copyright law. Duplication, processing, distribution and any type of exploitation outside the limits of copyright law require the written consent of the respective author or creator. Downloads and copies of this page are only permitted for private, non-commercial use. Insofar as the content on this page was not created by the operator, the copyrights of third parties are observed. In particular, third-party content is marked as such. Should you nevertheless become aware of a copyright infringement, we ask you to inform us accordingly. If we become aware of any infringements, we will remove such content immediately.
Data protection
Using our website is generally possible without providing personal data. If personal data (such as name, address or email addresses) is collected on our pages, this is always done on a voluntary basis wherever possible. This data will not be passed on to third parties without your express consent. We would like to point out that data transmission on the Internet (e.g. when communicating by email) can have security gaps. Complete protection of data against access by third parties is not possible. The use of contact data published as part of the imprint obligation by third parties to send unsolicited advertising and information materials is hereby expressly prohibited. The operators of the pages expressly reserve the right to take legal action in the event of unsolicited advertising information being sent, for example through spam emails.
Google Analytics
This website uses Google Analytics, a web analysis service provided by Google Inc. (“Google”). Google Analytics uses so-called “cookies”, text files that are stored on your computer and that enable an analysis of your use of the website. The information generated by the cookie about your use of this website (including your IP address) is transmitted to a Google server in the USA and stored there. Google will use this information to evaluate your use of the website, to compile reports on website activity for website operators and to provide other services related to website activity and internet usage. Google may also transfer this information to third parties where required to do so by law, or where third parties process this data on Google’s behalf. Google will never associate your IP address with other Google data. You can prevent the installation of cookies by setting your browser software accordingly; however, we would like to point out that in this case you may not be able to use all functions of this website to their full extent. By using this website, you consent to the processing of data about you by Google in the manner and for the purposes set out above.
Google AdSense
This website uses Google Adsense, a web advertising service provided by Google Inc., USA (“Google”). Google Adsense uses so-called “cookies” (text files) that are stored on your computer and that enable an analysis of your use of the website. Google Adsense also uses so-called “web beacons” (small invisible graphics) to collect information. By using the web beacon, simple actions such as visitor traffic on the website can be recorded and collected. The information generated by the cookie and/or web beacon about your use of this website (including your IP address) is transmitted to a Google server in the USA and stored there. Google will use this information to evaluate your use of the website in relation to the advertisements, to compile reports on website activity and advertisements for website operators and to provide other services relating to website activity and internet usage. Google may also transfer this information to third parties where required to do so by law, or where third parties process the data on Google’s behalf. Google will never associate your IP address with other Google data. You can prevent cookies from being saved on your hard disk and web beacons from being displayed by selecting “Do not accept cookies” in your browser settings (in MS Internet Explorer under “Tools > Internet Options > Privacy > Settings”; in Firefox under “Tools > Settings > Privacy > Cookies”); however, please note that if you do this you may not be able to use the full functionality of this website. By using this website you consent to the processing of data about you by Google in the manner and for the purposes set out above.